Written in 2026 for this archive, not by the Oregon Water Coalition. It explains background that the restored pages take for granted; check current rules with the agencies named in the sources before acting on anything here.
Look at a map of high-voltage lines in the Northwest and the Columbia River jumps out. Federal dams along it and its tributaries still anchor the region's power supply, and the agency that sells that power, the Bonneville Power Administration, touches almost every utility bill east of the Cascades in some way. This guide explains how the pieces fit, using BPA's own material, Oregon Department of Energy data and Congressional Research Service analysis.
A federal power marketer, not a dam owner
Congress created BPA in 1937 to sell power from Bonneville Dam and build the lines to carry it. Its role later expanded to marketing power from every federally owned hydroelectric project in the Northwest. Today BPA says it markets wholesale power from 31 federal hydroelectric projects, one nonfederal nuclear plant and several small nonfederal plants, and runs more than 15,000 miles of high-voltage transmission.
BPA does not own the dams. The Army Corps of Engineers operates 21 of them and the Bureau of Reclamation 10, according to Wikipedia's tally. The nuclear plant is the Columbia Generating Station on the Hanford Site in eastern Washington, operated by Energy Northwest.
Three facts define the agency:
- It is self-financing. BPA does not depend on annual appropriations; customers' payments for power and transmission fund it.
- It sells at cost rather than for profit, and by law must set rates on sound business principles to recover its costs.
- It provides about one-third of the electricity generated in the Northwest, mainly from what BPA calls dispatchable and flexible hydro.
The big dams
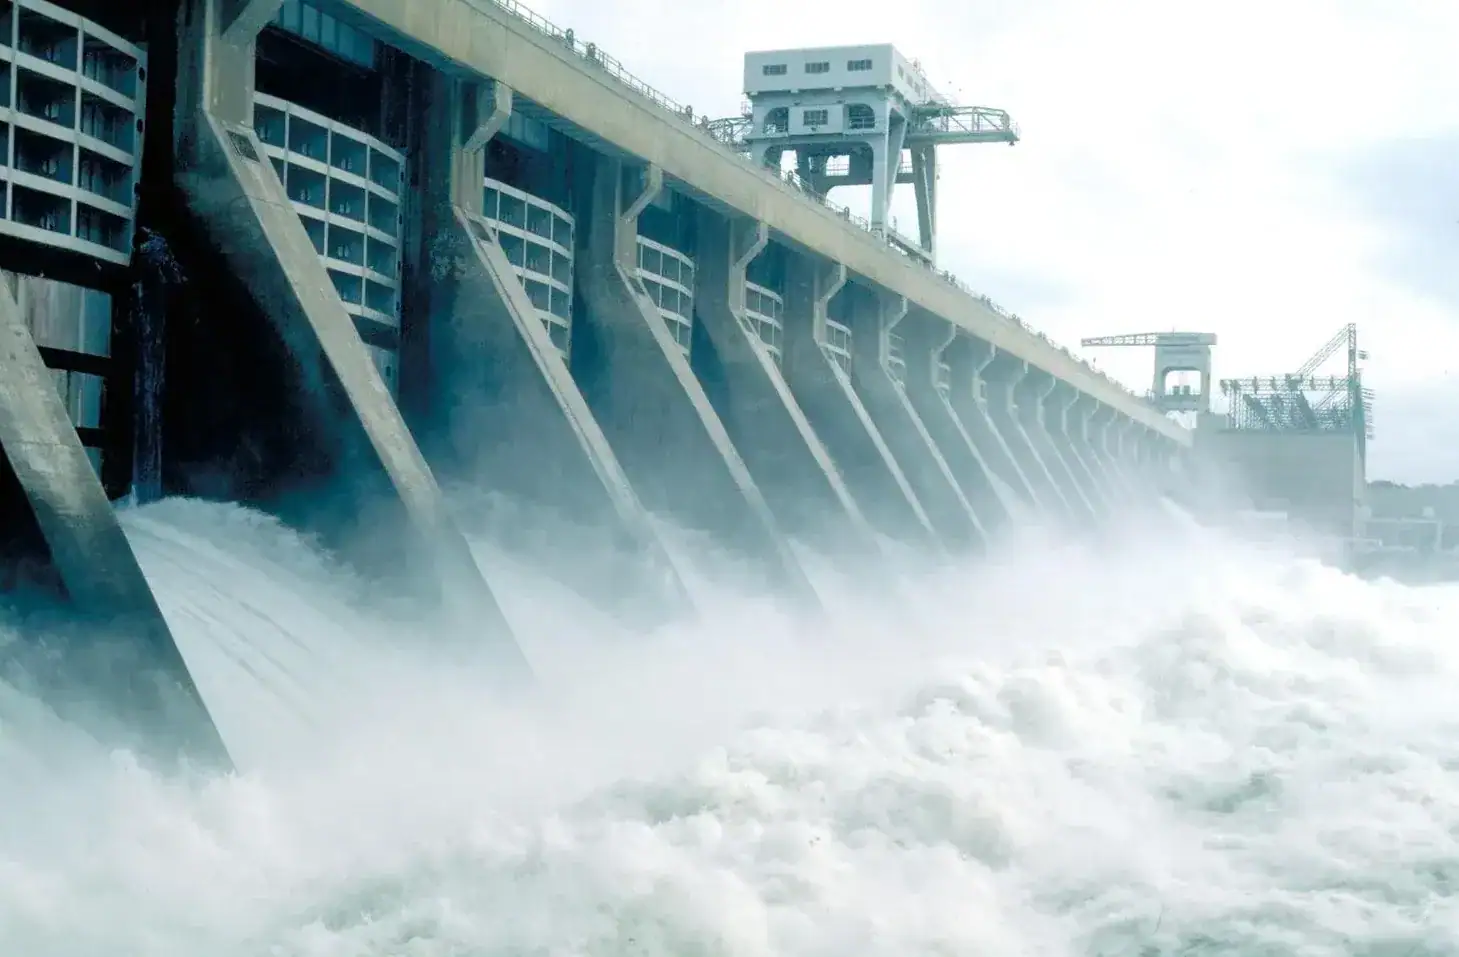
The Federal Columbia River Power System is the umbrella term for the federal projects whose power BPA sells. CRS counts 31 federal hydropower dams in the Columbia Basin; 14 main-stem projects are managed together as the "Columbia River System." Most of the capacity sits in a handful of plants.
| Dam | River | Max capacity | Opened | Operator |
|---|---|---|---|---|
| Grand Coulee | Columbia | 7,049 MW | 1942 | Reclamation |
| Chief Joseph | Columbia | 2,614 MW | 1958 | Corps |
| John Day | Columbia | 2,484 MW | 1971 | Corps |
| The Dalles | Columbia | 2,048 MW | 1957 | Corps |
| Bonneville | Columbia | 1,216 MW | 1938 | Corps |
| McNary | Columbia | 1,127 MW | 1954 | Corps |
Maximum capacities as listed in Wikipedia's table of BPA-marketed dams; for McNary, 1,127 MW is the overload rating and 1954 the year construction finished, per Wikipedia's McNary Dam article.
McNary, upstream of Umatilla, is the one most people in Hermiston and Boardman drive past. Its pool, Lake Wallula, is also the source for the Umatilla Basin Project's Columbia River exchange pumps.
The four lower Snake River dams add more than 3,000 MW of nameplate capacity, about 17 percent of the system's total, according to CRS. Their role is discussed in our guide to salmon and the Columbia–Snake dams.
Hydro's share of Oregon's power
Oregon's numbers depend on whether you count what is generated in the state or what Oregonians actually use, since power flows both ways across state lines. The Oregon Department of Energy (ODOE) measures use:
- Hydropower supplied about one-third of all electricity used in Oregon in 2024, the largest single resource.
- BPA provides about 29 percent of the electricity used in Oregon.
- Oregon has 91 hydropower facilities, including four federal dams on the Columbia that span the Oregon–Washington border and two facilities on the Oregon–Idaho border.
- Utilities bought about 13 million megawatt-hours of "unspecified" market power in 2024, electricity whose source cannot be traced to a particular plant.
Oregon's consumer-owned utilities, the cooperatives, people's utility districts and municipal systems, buy most of their power from BPA, so the federal hydro system sits behind much of their supply.
Wind, and why hydro flexibility matters
Twenty years ago, ODOE notes, wind and solar power were scarce in Oregon. Now ODOE counts 48 operating wind facilities in Oregon with 3,863 MW of capacity as of 2024, with another 200 MW project under construction.
Wind output rises and falls with the weather, so something has to fill the gaps minute by minute. Hydropower is well suited, because operators can ramp turbines up and down quickly. The 2020 federal environmental impact statement, quoted by CRS, credited the four lower Snake dams alone with more than 2,000 MW of sustained winter peaking capability and a quarter of BPA's reserve-holding capability. Wikipedia's Snake River article makes the general point: as more wind and solar join the grid, more balancing is needed.
There is a limit to that flexibility. The same water also has to meet fish operations, flood control, navigation and irrigation, and in dry years the river simply carries less. Spill for juvenile salmon, for example, passes water over spillways instead of through turbines.
Data centers and load growth
For decades the Northwest's power planning assumed modest demand growth. That has changed. ODOE's 2026 Biennial Energy Report found the commercial sector's share of statewide energy consumption rose from 16 to 20 percent between 2022 and 2024, the highest share on record, with data center expansion a main driver. ODOE also reports that forecast load growth from new data centers is the single largest reason Oregon is no longer on track for its sector-based climate goals, accounting for 34 percent of forecast emissions by 2050 unless those facilities run on clean power.
Much of that new load is in Morrow and Umatilla counties, which is covered in our guide to Boardman, Hermiston and Morrow County.
Rates: the BP-26 increase
BPA sets rates in formal cases. The BP-26 rate case, decided July 24, 2025, covers fiscal years 2026 through 2028, October 1, 2025, through September 30, 2028. Results, settled with customers:
- an average effective increase of 8.9 percent for the Priority Firm Tier 1 power rate, which covers most of BPA's power sales;
- an average increase of 19.9 percent across transmission products.
BPA said both were lower than its initial proposal and followed more than a decade of increases at or below inflation. The case was a one-time three-year period, timed to the end of the long-term "Regional Dialogue" contracts. New long-term "Provider of Choice" contracts begin October 1, 2028, and the BP-29 case will set rates for them.
Markets and the grid
On May 9, 2025, BPA issued a policy and record of decision choosing to pursue Southwest Power Pool's Markets+ day-ahead market, over the main alternative from the California grid operator. BPA cited customer value, independent governance and preserving the benefits of the federal system. Joining still requires further rate, tariff and contract steps.
BPA's lines also connect the Northwest to California. The Pacific DC Intertie runs from the Celilo Converter Station near The Dalles to Los Angeles, about 800 miles, alongside AC lines to California and ties to British Columbia.
Fish costs on the power bill
BPA's ratepayers also fund fish and wildlife mitigation under the Northwest Power Act of 1980. A small, local example: under the 1988 Umatilla Basin Project Act, Congress directed Bonneville to pay for the power that runs the Columbia River exchange pumps near Hermiston, reported by the Oregon Encyclopedia at $1.1 million to $1.6 million a year to Umatilla Electric Cooperative. Larger programs fund hatcheries, passage work and habitat across the basin.
Where this leaves eastern Oregon
Cheap, flexible hydro is a big part of why food processors, cold storage and data centers located along the Columbia. Rising demand, higher transmission costs and the unresolved salmon litigation are now pressing on that advantage at the same time. For local businesses, utility account managers and energy consultants are usually the first stop for questions about rates and new service.
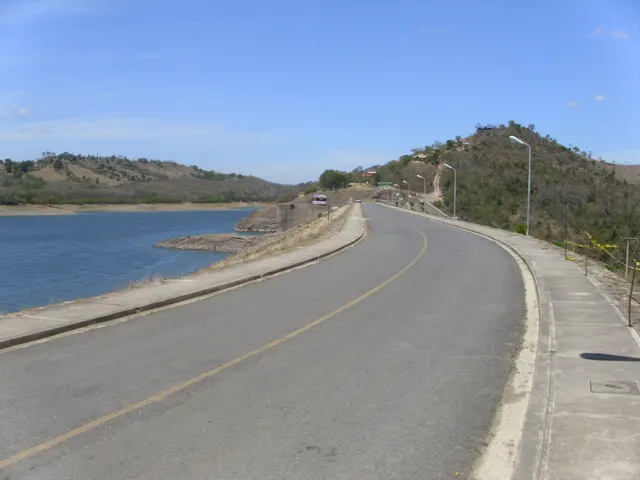
Multi-purpose dams that serve power, irrigation and cities at once are not unique to the Columbia. For a look at the same bargain on a Caribbean river, see our field trip through the Dominican Republic's irrigated valleys, where the Tavera and Hatillo dams feed rice country and the grid.
Questions people ask
Does BPA own the dams?
No. BPA markets the power. The 31 federal hydroelectric dams it sells power from are owned and operated by the U.S. Army Corps of Engineers or the Bureau of Reclamation.
How much of Oregon's electricity comes from hydropower?
The Oregon Department of Energy reports that hydropower supplied about one-third of all electricity used in Oregon in 2024, more than any other single resource. BPA alone provides about 29 percent of the electricity used in the state.
Why do BPA rates matter to rural eastern Oregon?
Consumer-owned utilities, such as cooperatives and people's utility districts, buy most of their power from BPA. When BPA's wholesale rates change, those utilities' costs change too. For fiscal 2026 through 2028, BPA's main power rate rose an average 8.9 percent and transmission rates an average 19.9 percent.
Is BPA funded by taxpayers?
BPA describes itself as self-financing. It does not depend on annual appropriations from Congress; its operations are paid for by revenue from power and transmission customers.
Sources
- Bonneville Power Administration, Who We Are
- BPA, BPA and customers settle strategic rate increases (July 24, 2025)
- BPA, BPA issues day-ahead market policy to pursue participation in SPP market (May 9, 2025)
- Oregon Department of Energy, 2026 Biennial Energy Report: Energy by the Numbers
- Congressional Research Service, Columbia River System Operations and the Future of the Lower Snake River Dams (R49059)
- Wikipedia, Bonneville Power Administration
- Wikipedia, McNary Dam
- Oregon Encyclopedia, Umatilla River