Coalition pagesIrrigation & farmsWater rights & law
Agriculture & irrigation fact sheets
Restored from the 2017–2023 coalition website, as captured on June 4, 2023. The text is kept as published. Dead links and contact details have been removed.
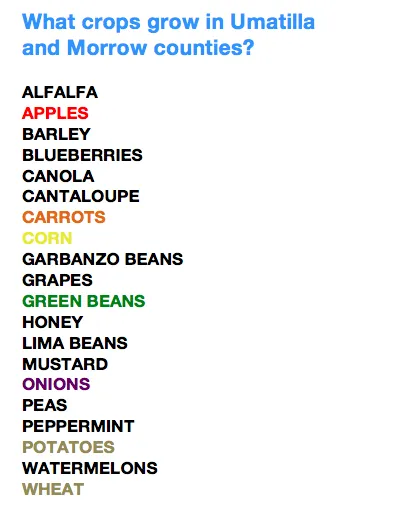
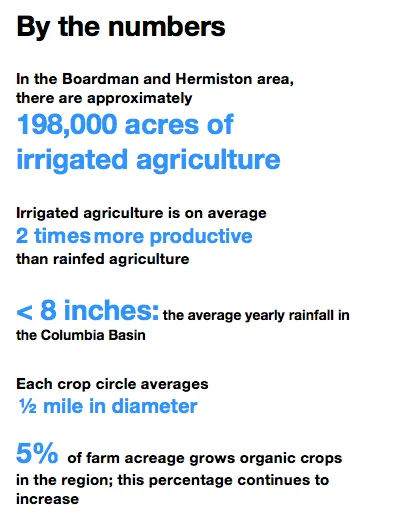
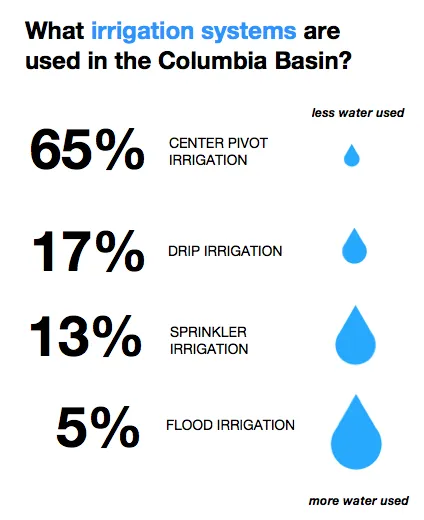
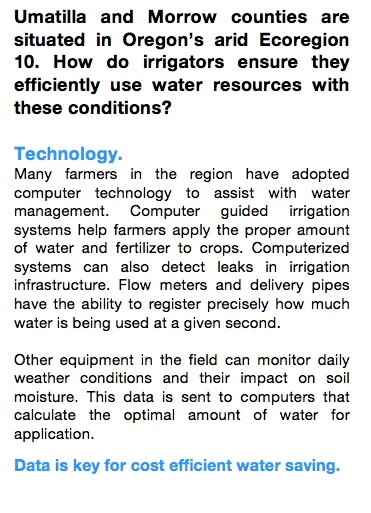
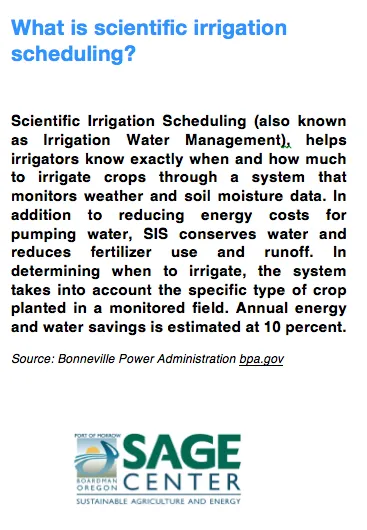
This gallery is made possible through collaboration with the SAGE Center. The SAGE Center offers an interactive, educational experience for visitors to engage with information about agriculture and energy in Umatilla and Morrow counties. The SAGE Center is located at the Port of Morrow in Boardman, OR. More information: visitsage.com.
Added in 2026
Context for “Agriculture & irrigation fact sheets”
The fact sheets were image slides produced with the SAGE Center at the Port of Morrow in Boardman, a visitor centre about agriculture and energy in Umatilla and Morrow counties that opened in 2013. The slide images that could be recovered are shown above.
The slide files were uploaded to the coalition's site in March 2017, so their figures describe conditions at that time or earlier. For current crop, acreage and water-use numbers, the usual primary sources are the USDA census of agriculture (every five years, most recently for 2022) and Oregon State University extension reports.
Are the numbers on these fact sheets current?
No. The slides were uploaded in March 2017. Use the most recent USDA census of agriculture or county extension data for current figures.